I love earnings season. New information abounds and the stock market is constantly trying to reprice thousands of securities based on this new data. It creates periods of temporary imbalances in supply and demand, which leads to a very inefficient market in the short-term. Put another way, we can make LOTS of money if we do our homework. The problem thus far in 2022 is that we’ve been in a cyclical bear market. Good news from earnings has mostly been ignored as nearly every stock, outside of energy, has suffered from the anticipation of higher inflationary pressures and uncertain economic conditions.
But that is changing this earnings season and the S&P 500 fully priced in those inflationary and recessionary concerns. Current technical conditions are confirming the market bottom from June 16-17. As earnings season kicks into full gear, we are going to be inundated with opportunities. As interest rates continue to fall later in 2022, growth stocks will explode – particularly those that report strong results and raise guidance. The gaps created by these strong reports will likely be tested during profit taking episodes, so if we do our homework and are patient, opportunities for excellent reward to risk trades will increase significantly.
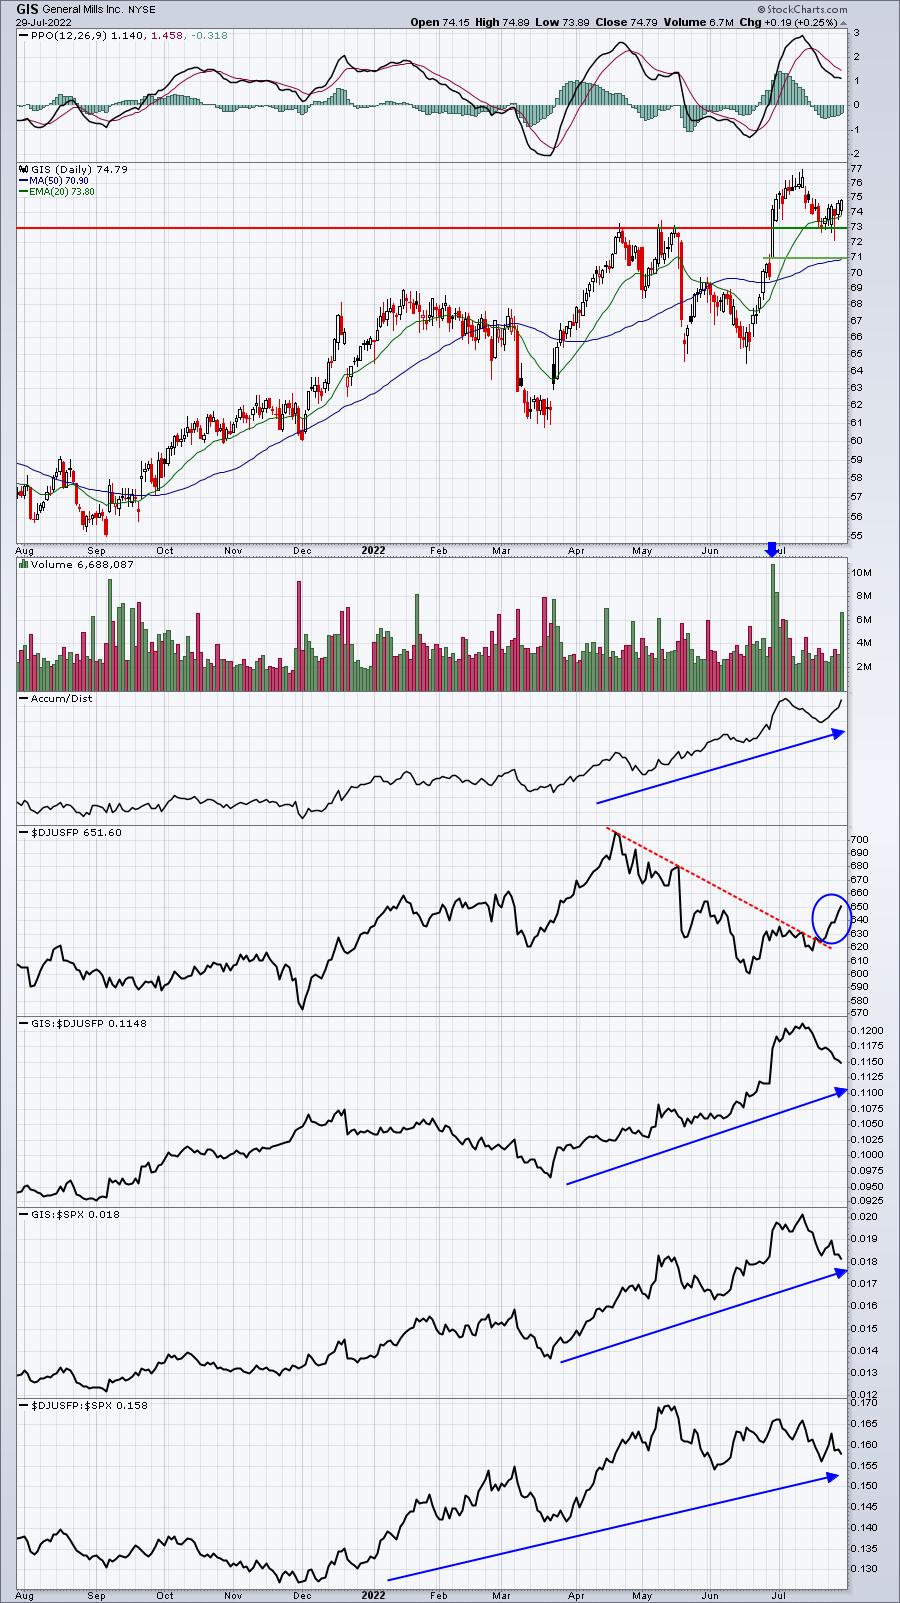
One example is General Mills (GIS), which is a consumer staple name. After posting much-better-than-expected revenues and EPS, GIS gapped higher on June 29th and hasn’t looked back:
Note that the GIS post-earnings volume was the heaviest of the past 52 weeks. That’s the imbalance of demand (vs. supply) that I discussed earlier. When everyone wants to buy, market makers must take short positions to provide liquidity to the market. That normally results in prices returning to prior day’s closing prices (gap fill). But when market makers are on the short side and prices continue rising, that suggest tremendous demand. For me, it simply becomes a matter of timing an entry. I want to own stocks that create insatiable demand. Now keep in mind that GIS is a consumer staple stock that isn’t going to typically make huge runs in either direction. It generally will move much slower than say a volatile growth stock. However, profit opportunities on defensive stocks still abound too.
It’s also important to note those bottom panels in the chart above. GIS is showing excellent relative strength vs. its food products peers and has been outperforming the S&P 500. This is the type of leadership that I’ll gladly include in my own trading portfolio.
I see two primary support levels on GIS. First, we broke out above prior highs near the 73 level. Broken price resistance becomes price support, especially when the breakout occurs on heavy volume. Even if GIS were to lose 73 support, however, I really like the stock at 71.02, which is where GIS opened after its blowout earnings. I’d be very surprised if GIS closes beneath 71 on a forward-looking basis. Therefore, a trading strategy to buy GIS at 73, then 71, would result in an average cost of 72. Any close below 71 would be my stop, so I’d be risking very little on this trade with an opportunity for much further upside.
I plan to feature one of my favorite Q2 earnings reports in my FREE EB Digest newsletter tomorrow, Monday, August 1st. If you’d like to see it, including how I’d set up a trading strategy, simply CLICK HERE and enter your name and email address. There is no credit card required and you may unsubscribe at any time.
Happy trading!
Tom