

[ad_1]
Crude Oil Price Talking Points
The price of oil retraces the decline from earlier this week following another contraction in US inventories, and crude appears to be breaking out of a descending channel amid the failed attempts to close below the 200-Day SMA ($94.20).
Oil Price Breaks Out of Descending Channel After Testing 200-Day SMA
The price of oil trades above channel resistance after defending last week’s low ($90.65), and crude may stage a larger recovery over the coming days as it fresh data prints coming out of the US economy instill a positive outlook for consumption.
The update from the Energy Information Administration (EIA) shows crude inventories narrowing 4.523M in the week ending July 22 versus forecasts for a 1.037M decline, and the development may keep the Organization of Petroleum Exporting Countries (OPEC) on its current course with the group on track to “adjust upward the monthly overall production for the month of August 2022 by 0.648 mb/d.”
Signs of robust demand may push OPEC to boost production as the most recent Monthly Oil Market Report (MOMR) states that “for 2022, world oil demand is foreseen to rise by 3.4 mb/d, unchanged from last month’s estimate,” but it remains to be seen if the group will respond to the rebound in US output as it approaches pre-pandemic levels.
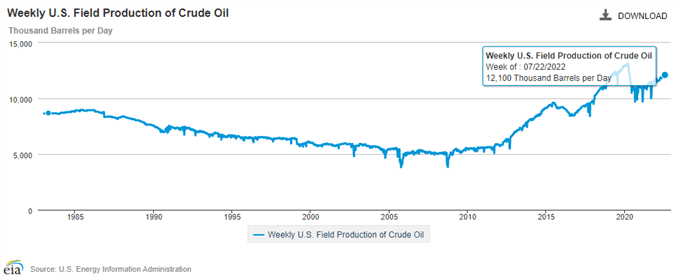
A deeper look at the figures from the EIA show weekly field production climbing to 12,100K in the week ending July 22 from 11,900K the week prior, and the recovery in US output may encourage OPEC to retain the current production schedule at the next Ministerial Meeting on August 3 as the group anticipates less demand in 2023.
Until then the price of oil may continue to consolidate as it trades within last week’s range, but the string of failed attempts to close below the 200-Day SMA ($94.20). may generate a larger recovery in crude as it appears to be breaking out of a descending channel.
With that said, the price of oil is on the cusp of pushing above the weekly high ($99.00) as the moving average appears to be acting as support, and crude may attempt to retrace the decline from the monthly high ($111.45) as it clears channel resistance.
Crude Oil Price Daily Chart
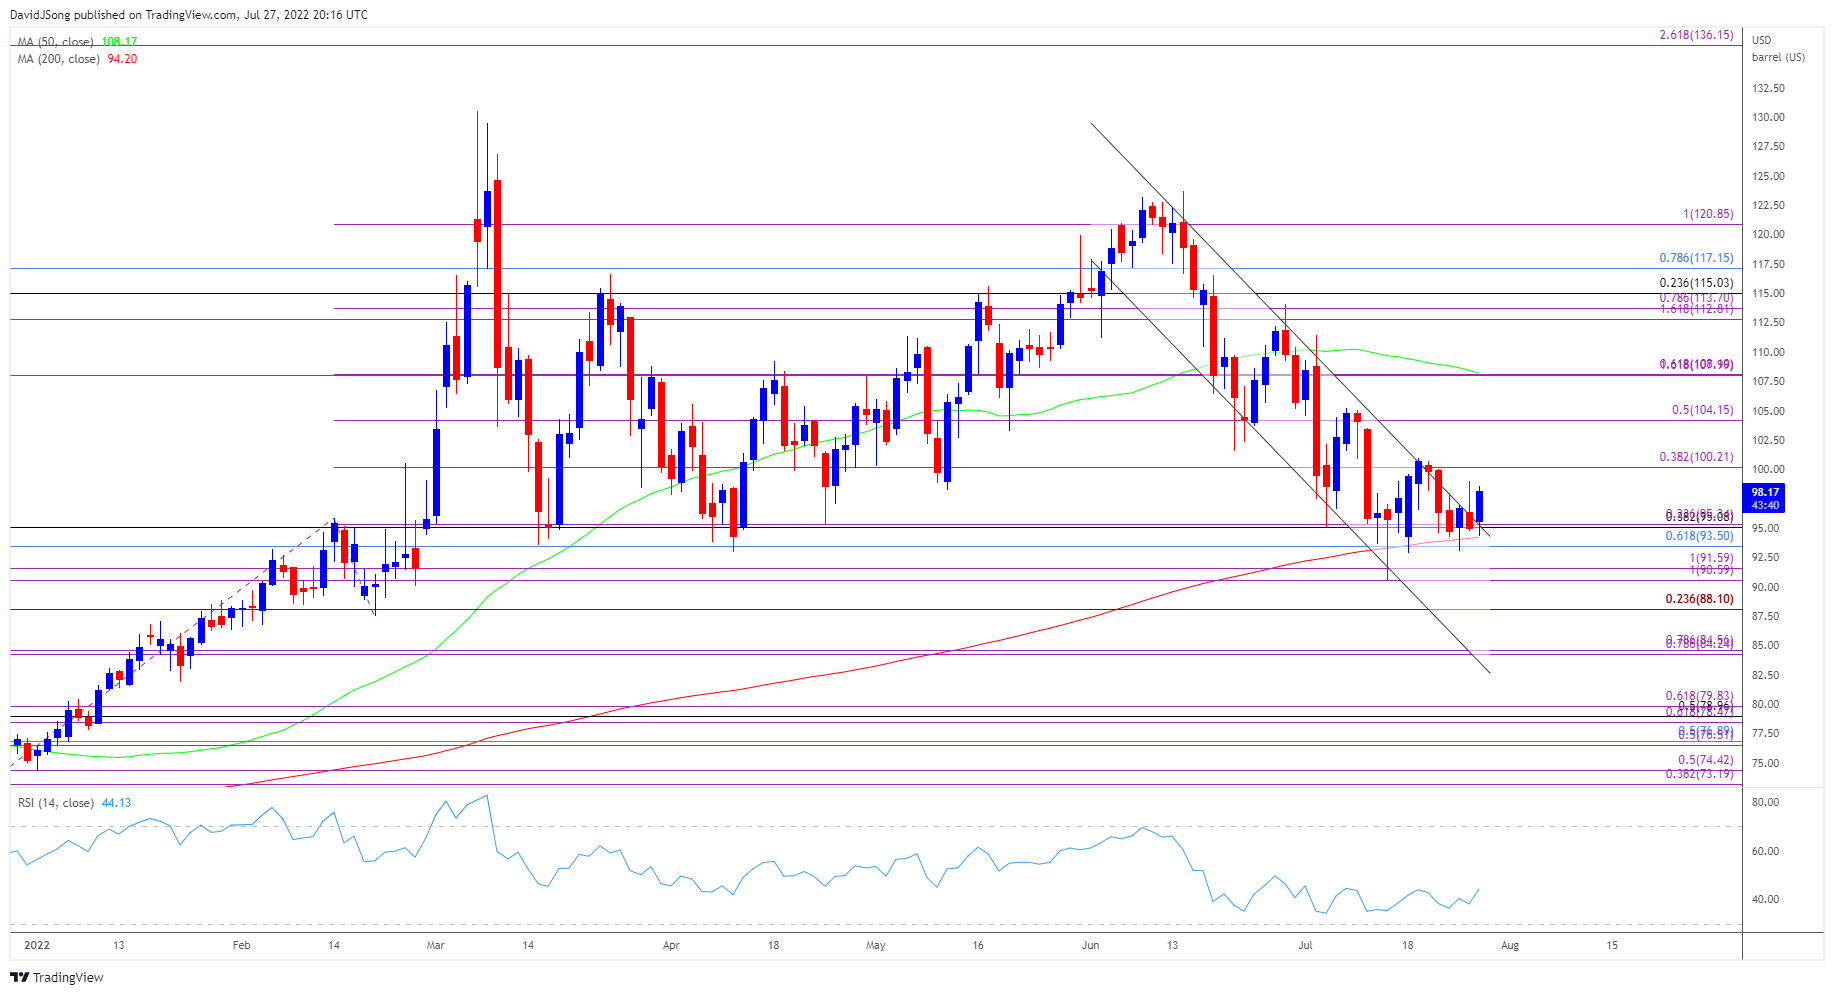
Source: Trading View
- The price of oil appears to be reversing course ahead of the February low ($86.55) amid the failed attempt to close below the 200-Day SMA ($94.20), and recent price action raises the scope for a larger recovery as crude breaks out of a descending channel.
- Lack of momentum to close below the Fibonacci overlap around $93.50 (61.8% retracement) to $95.30 (23.6% expansion) may push the price of oil back towards $100.20 (38.2% expansion), with the next area of interest coming in around $104.20 (50% expansion).
- Need a close above the $108.00 (161.8% expansion) to $108.10 (61.8% expansion) region to bring the monthly high ($111.45) on the radar, with the next area of interest coming in around $112.80 (161.8% expansion) to $113.70 (78.6% expansion).
— Written by David Song, Currency Strategist
Follow me on Twitter at @DavidJSong
[ad_2]
Image and article originally from www.dailyfx.com. Read the original article here.