In the discipline of Technical Analysis, there are patterns that can be classified as Reversal Patterns or Continuation Patterns. Where Reversal patterns tend to reverse the prior trend; Continuation patterns tend to resolve in the direction of the prior trend.
One such “Reversal Pattern” is the Inverted (Or, Inverse) Head and Shoulders Pattern which is considered a bullish reversal pattern. This is the exact opposite of Head and Shoulders which is one of the major bearish reversal patterns.
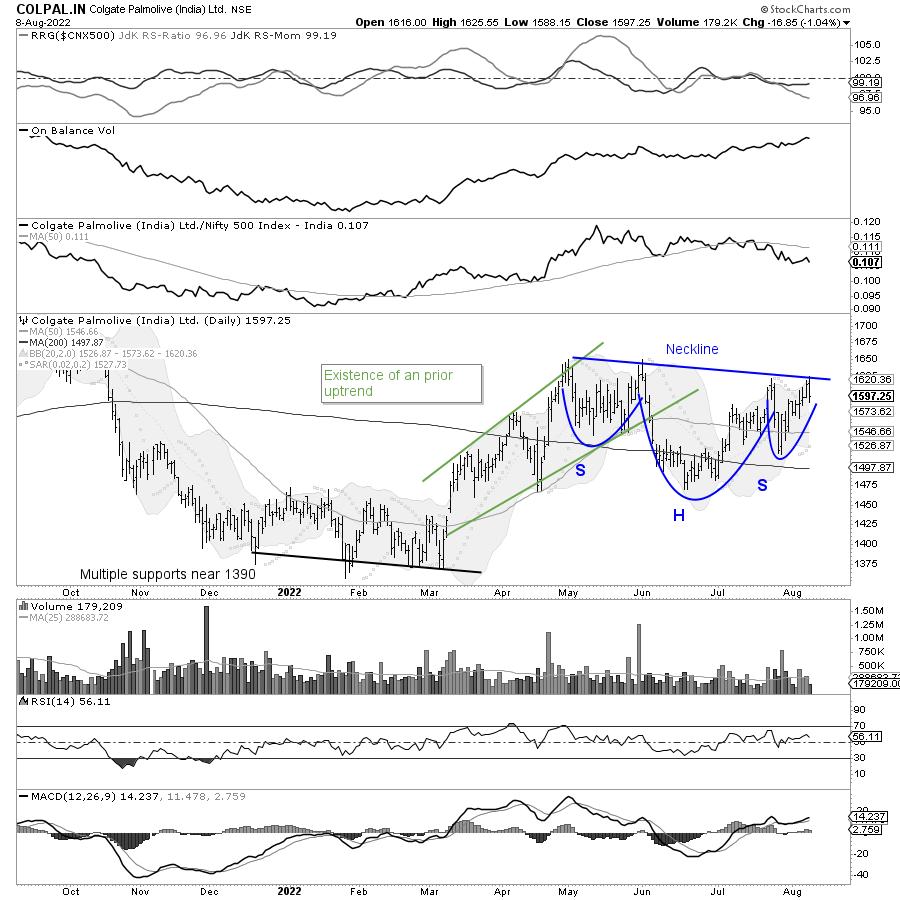
However, there are times, when this bullish reversal pattern — Inverted Head & Shoulders often acts as a “Continuation Pattern”; during the such instance, such a pattern developed following an existing uptrend and results in the continuation of the uptrend. The most recent example of this happening is seen on Colgate Palmolive (India) Ltd — COLPAL chart.
COLPAL peaked at 1823.40 in July 2021, after that it s stayed largely in a corrective trend. After the high of 1823.40, the price action subsequently marked lower highs near 1751, and 1824 before marking multiple support points near 1390. The prices took support here a number of times, the stock staged a rally from 1390 to test the most recent high point at 1672 in May 2022.
From May 2022 until today, the price action has resulted in a complex Inverse Head & Shoulder formation. Generally speaking, such inverted Head & Shoulder formation `is a bullish reversal pattern and generally emerges following a decline, in the present case, it has developed following a rally and may act as a continuation pattern.
This is not a classically flat inverse Head & Shoulder pattern, but a complex and sloping one. However, it is very much a valid one as it has developed over two months. The neckline is placed at 1600 and the stock has tried to stage a breakout from this pattern.
The RSI has marked a new 14-period high; however, it is neutral and does not show any divergence against the price. The MACD is bullish and above the signal line. Importantly, the Histogram is seen widening; this implies acceleration in the momentum on the upside.
If the present pattern resolves on the expected lines, the stock may test 1750-1785 levels. Major support at Close levels exists in form of 200-DMA placed currently at 1511. Any close below 1500 will negate this view.
Milan Vaishnav, CMT, MSTA
Consulting Technical Analyst
www.EquityResearch.asia | www.ChartWizard.ae
Disclosure pursuant to Clause 19 of SEBI (Research Analysts) Regulations 2014: Analyst, Family Members, or his Associates holds no financial interest below 1% or higher than 1% and has not received any compensation from the Companies discussed.
The securities discussed and opinions expressed in this report may not be suitable for all investors, who must make their own investment decisions, based on their own investment objectives, financial positions, and needs of specific recipients. This may not be taken in substitution for the exercise of independent judgment by any recipient.
The recipient should independently evaluate the investment risks. The value and return on investment may vary because of changes in interest rates, foreign exchange rates, or any other reason. Past performance is not necessarily a guide to future performance. The usage of the Research Reports and other Services are governed as per the Terms of Service on https://equityresearch.asia/terms-of-use
The Research Analyst has not managed or co-managed the issues of any of the companies discussed and has not received any such remuneration from such activities from the companies discussed.
The Research Analyst has not received any remuneration from the Merchant Banking activities.
The Research Analyst has adopted an independent approach without any conflict from anyone. The Research Analyst has not received any compensation or other benefits from the companies mentioned in the report or third party in connection with the preparation of the research report.
Compensation of the Research Analysts is not based on any specific merchant banking, investment banking, or brokerage service transactions.
The Research Analyst is not engaged in a market-making activity for the companies mentioned in the report.
The Research Analyst submits that no material disciplinary action has been taken on him by any Regulatory Authority impacting Equity Research Analysis activities.
This report is not directed or intended for distribution to, or use by, any person or entity who is a citizen or resident of or located in any locality, state, country, or other jurisdiction, where such distribution, publication, availability, or use would be contrary to law, regulation or which would subject the Research Analyst to any registration or licensing requirement within such jurisdiction.